Examples
This page is intended to showcase different charts along with the code required to create them. For an introduction to clj-xchart, see the tutorial.
To follow along, you can for example use lein-try and type the following:
$ lein try com.hypirion/clj-xchart

;; Some startup info from the repl

user=> (require '[com.hypirion.clj-xchart :as c])
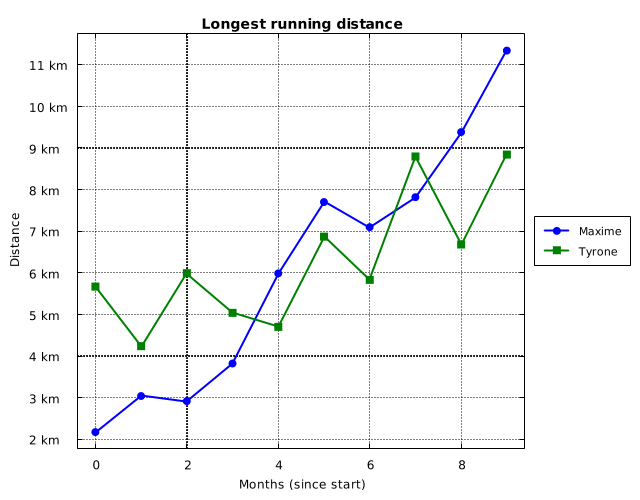
Line Charts
(def r (java.util.Random. 42))

(c/view
 (c/xy-chart
  {"Maxime" {:x (range 10)
             :y (mapv #(+ % (* 3 (.nextDouble r)))
                      (range 10))}
   "Tyrone" {:x (range 10)
             :y (mapv #(+ 2 % (* 4 (.nextDouble r)))
                      (range 0 5 0.5))}}
  {:title "Longest running distance"
   :x-axis {:title "Months (since start)"}
   :y-axis {:title "Distance"
            :decimal-pattern "##.## km"}
   :theme :matlab}))
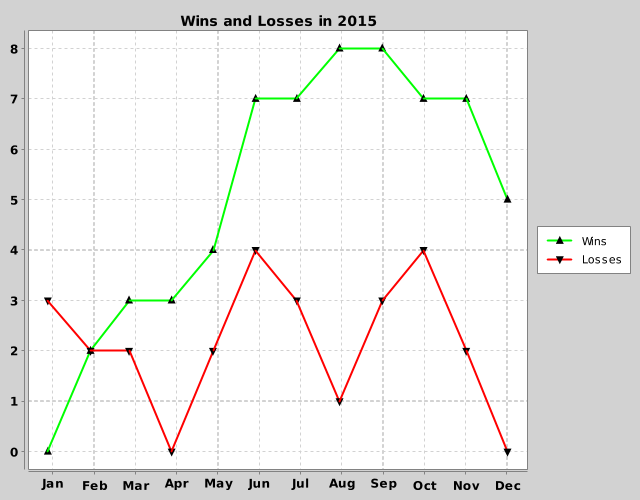
(import 'java.util.GregorianCalendar)

(defn months [year]
  (map (fn [month]
         (let [c (GregorianCalendar.)]
           (.set c year month 1)
           (.getTime c)))
       (range 12)))

(c/view
 (c/xy-chart
  {"Wins" {:x (months 2015)
           :y [0 2 3 3 4 7 7 8 8 7 7 5]
           :style {:marker-type :triangle-up
                   :marker-color :black
                   :line-color :green}}
   "Losses" {:x (months 2015)
             :y [3 2 2 0 2 4 3 1 3 4 2 0]
             :style {:marker-type :triangle-down
                     :marker-color :black
                     :line-color :red}}}
  {:title "Wins and Losses in 2015"
   :date-pattern "MMM"}))
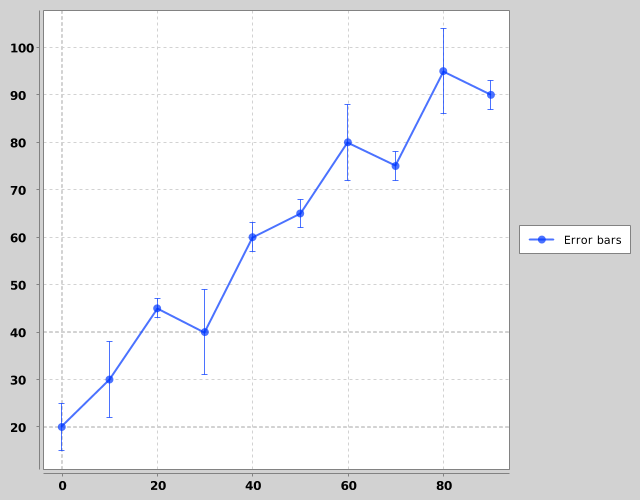
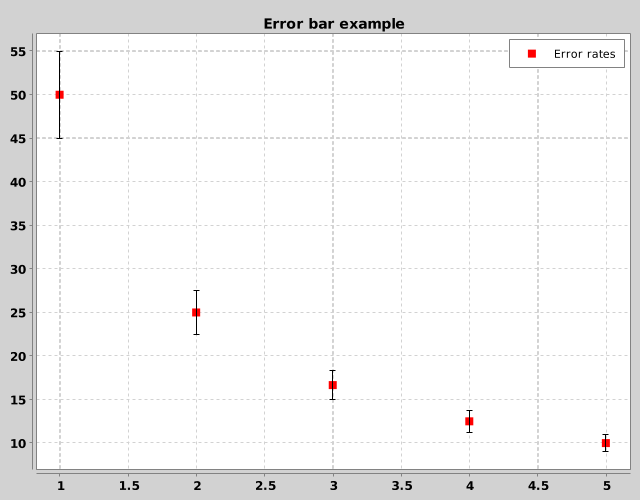
Error Bars
(c/view
 (c/xy-chart
  {"Error bars" {:x (range 0 100 10)
                 :y [20 30 45 40 60 65 80 75 95 90]
                 :error-bars [5 8 2 9 3 3 8 3 9 3]}}
  {:error-bars-color :match-series}))
(c/view
 (c/xy-chart
  {"Error rates" {:x [1 2 3 4 5]
                  :y [50.0 25.0 16.66 12.5 10.0]
                  :error-bars [5.0 2.5 1.66 1.25 1.0]
                  :style {:marker-type :square
                          :marker-color :red}}}
  {:title "Error bar example"
   :render-style :scatter
   :legend {:position :inside-ne}}))
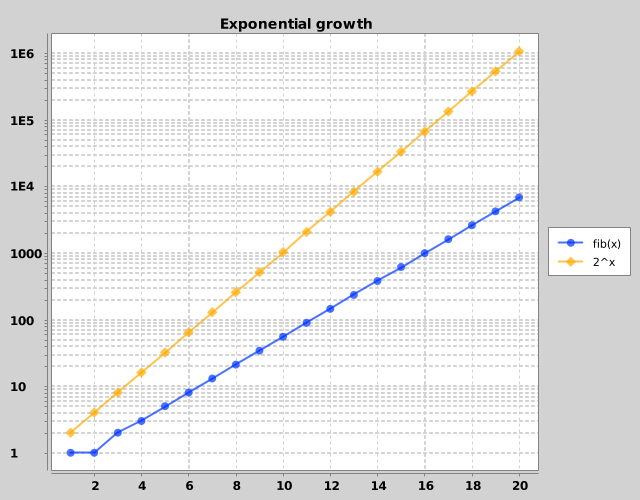
Logarithmic Scale
(def fib
  (list* 0 1
         (lazy-seq (map + fib (rest fib)))))

(c/view
 (c/xy-chart
  {"fib(x)" {:x (range 1 21)
             :y (take 20 (rest fib))}
   "2^x" {:x (range 1 21)
          :y (map #(Math/pow 2 %) (range 1 21))}}
  {:title "Exponential growth"
   :y-axis {:logarithmic? true}}))
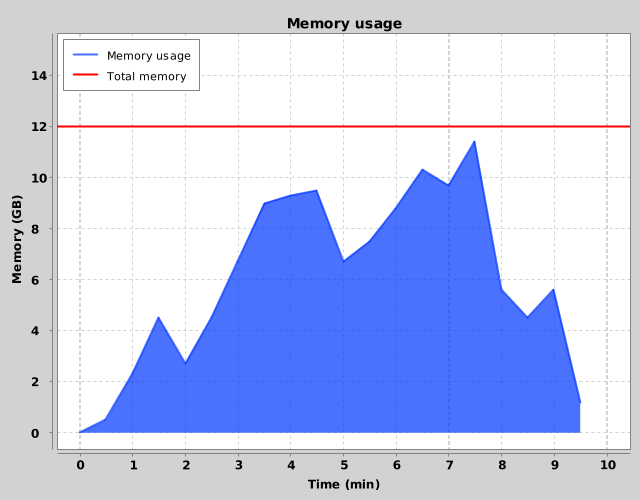
Area Charts
(c/view
 (c/xy-chart
  {"Memory usage" {:x (range 0 10 0.5)
                   :y [0.0 0.5 2.3 4.5 2.7 4.5 6.7
                       9.0 9.3 9.5 6.7 7.5 8.8 10.3
                       9.7 11.4 5.6 4.5 5.6 1.2]
                   :style {:marker-type :none}}
   "Total memory" {:x [-100 100]
                   :y [12 12]
                   :style {:render-style :line
                           :marker-type :none
                           :line-color :red}}}
  {:title "Memory usage"
   :render-style :area
   :x-axis {:title "Time (min)"
            :min 0
            :max 10}
   :y-axis {:title "Memory (GB)"
            :max 15}
   :legend {:position :inside-nw}}))
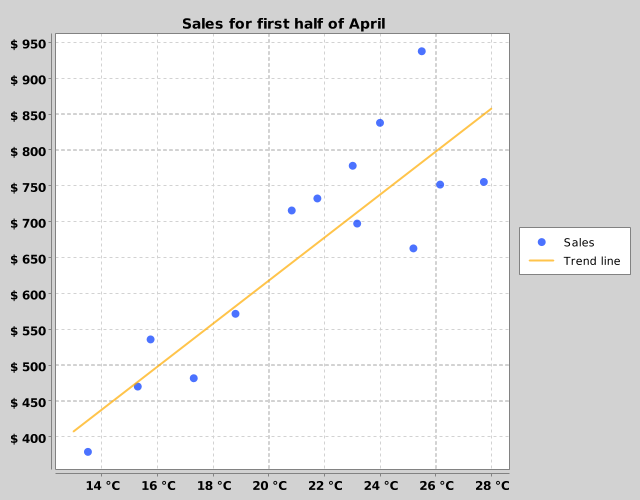
Scatter Charts
(def april-data
  [{:temperature 21.76, :income 732.69}
   {:temperature 23.19, :income 697.69}
   {:temperature 18.82, :income 571.86}
   {:temperature 23.03, :income 778.27}
   {:temperature 27.74, :income 755.72}
   {:temperature 24.01, :income 838.15}
   {:temperature 25.21, :income 663.07}
   {:temperature 15.77, :income 536.15}
   {:temperature 25.51, :income 937.94}
   {:temperature 20.84, :income 715.92}
   {:temperature 13.52, :income 379.37}
   {:temperature 17.32, :income 482.05}
   {:temperature 15.31, :income 470.40}
   {:temperature 26.17, :income 752.04}])

(c/view
 (c/xy-chart
  {"Sales" (c/extract-series
            {:x :temperature
             :y :income}
            april-data)
   "Trend line" {:x [13 28]
                 :y [408 858]
                 :style {:render-style :line
                         :marker-type :none}}}
   {:title "Sales for first half of April"
    :y-axis {:decimal-pattern "$ #,###.##"}
    :x-axis {:decimal-pattern "##.## °C"}
    :render-style :scatter}))
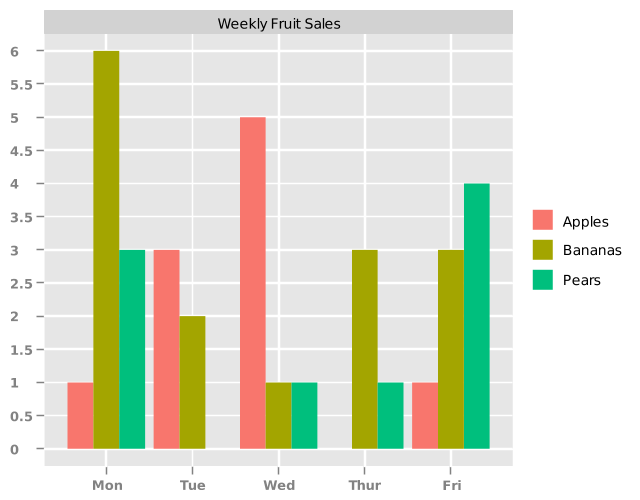
Category Charts
(c/view
 (c/category-chart
  {"Bananas" {"Mon" 6, "Tue" 2, "Fri" 3, "Wed" 1, "Thur" 3}
   "Apples" {"Tue" 3, "Wed" 5, "Fri" 1, "Mon" 1}
   "Pears" {"Thur" 1, "Mon" 3, "Fri" 4, "Wed" 1}}
  {:title "Weekly Fruit Sales"
   :theme :ggplot2
   :x-axis {:order ["Mon" "Tue" "Wed" "Thur" "Fri"]}}))
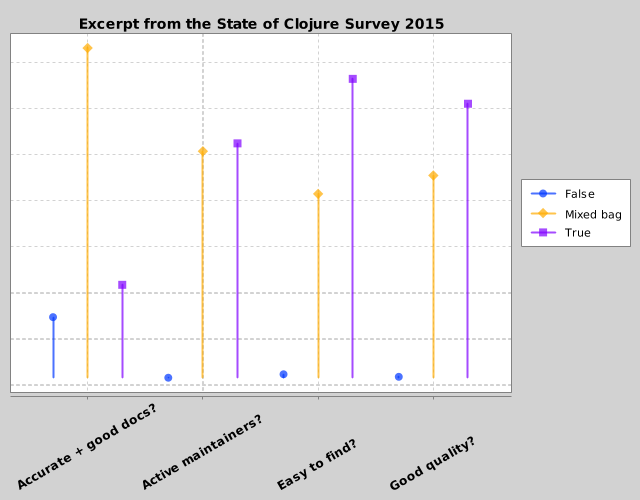
Stick Charts
(c/view
 (c/category-chart
  (c/transpose-map
   {"Easy to find?" {"True" 1329,
                     "False" 47,
                     "Mixed bag" 830},
    "Active maintainers?" {"True" 1049,
                           "False" 32,
                           "Mixed bag" 1015},
    "Accurate + good docs?" {"True" 435,
                             "False" 295,
                             "Mixed bag" 1463},
    "Good quality?" {"True" 1221,
                     "False" 36,
                     "Mixed bag" 910}})
  {:title "Excerpt from the State of Clojure Survey 2015"
   :render-style :stick
   :y-axis {:ticks-visible? false}
   :x-axis {:label {:rotation 30}}}))
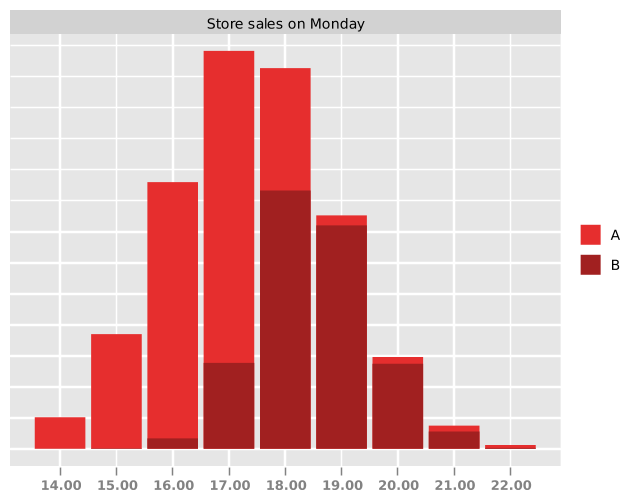
Overlapping Category Chart
(import '(java.awt Color))

(def my-red (Color/getHSBColor 0.0 0.8 0.9))
(def my-darker-red (.darker my-red))

(c/view
 (c/category-chart
  {"A" {:x [14 15 16 17 18 19 20 21 22]
        :y [2.03 7.39 17.20 25.66 24.55
            15.05 5.92 1.49 0.24]
        :style {:fill-color my-red}}
   "B" {:x [14 15 16 17 18 19 20 21 22]
        :y [0.01 0.03 0.67 5.54 16.66
            14.41 5.48 1.11 0.06]
        :style {:fill-color my-darker-red}}}
  {:title "Store sales on Monday"
   :overlap? true
   :theme :ggplot2
   :series-order ["A" "B"]
   :y-axis {:ticks-visible? false}
   :x-axis {:decimal-pattern "##.00"}}))
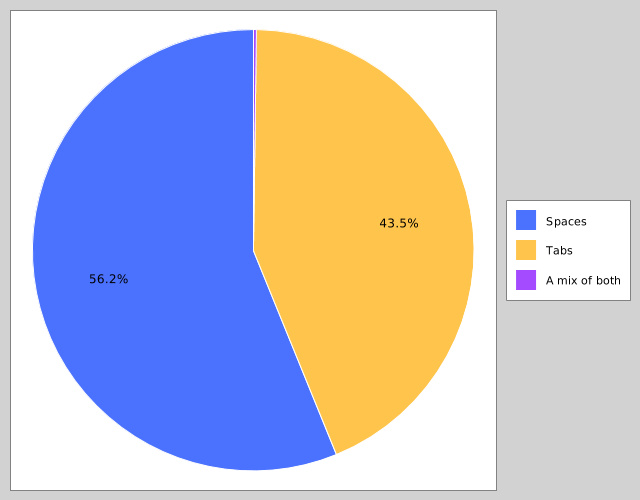
Pie Charts
(c/view
 (c/pie-chart {"Spaces" 400
               "Tabs" 310
               "A mix of both" 2}))
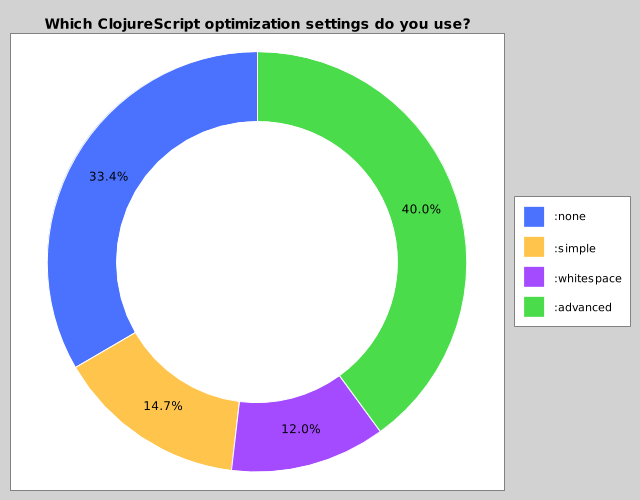
Donut Charts
(c/view
 (c/pie-chart
  {":none" 845
   ":simple" 371
   ":whitespace" 303
   ":advanced" 1013}
  {:title (str "Which ClojureScript optimization "
               "settings do you use?")
   :render-style :donut
   :annotation-distance 0.82}))
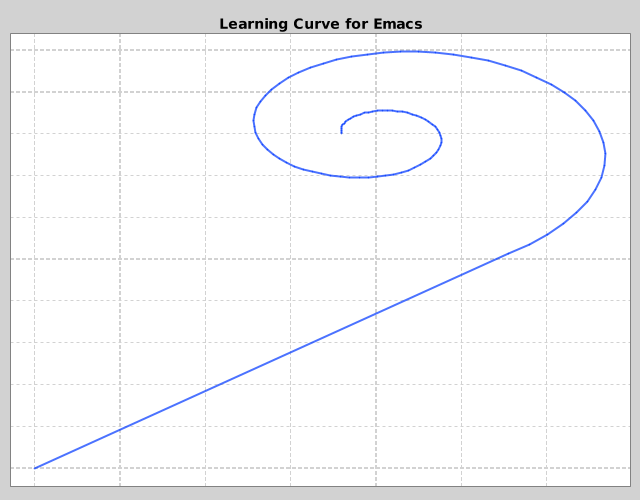
Misc
(defn log-spiral-x [a b t]
  (* a (Math/exp (* b t)) (Math/cos t)))
(defn log-spiral-y [a b t]
  (* a (Math/exp (* b t)) (Math/sin t)))

(c/view
 (c/xy-chart
  {"curve" {:x (cons 0 (map #(+ 2 (log-spiral-x -0.2 0.2 %))
                            (range 10.5 0 -0.1)))
            :y (cons 0 (map #(+ 4 (log-spiral-y 0.2 0.2 %))
                            (range 10.5 0 -0.1)))
            :style {:marker-type :none}}}
  {:title "Learning Curve for Emacs"
   :legend {:visible? false}
   :axis {:ticks {:visible? false}}}))
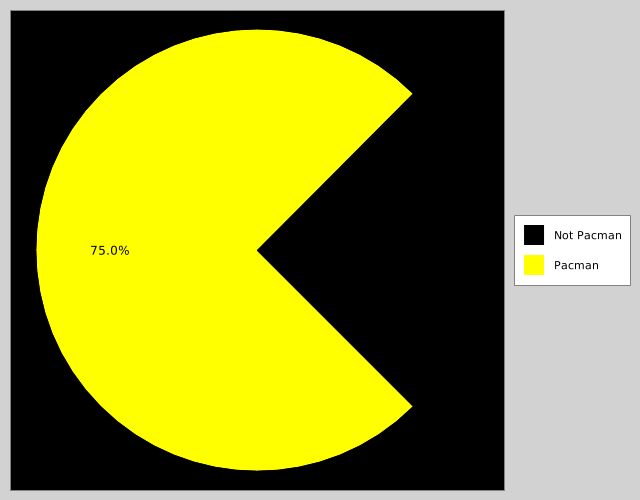
(c/view
 (c/pie-chart
  [["Not Pacman" 1/4]
   ["Pacman" 3/4]]
  {:start-angle 225.0
   :plot {:background-color :black}
   :series [{:color :black} {:color :yellow}]}))