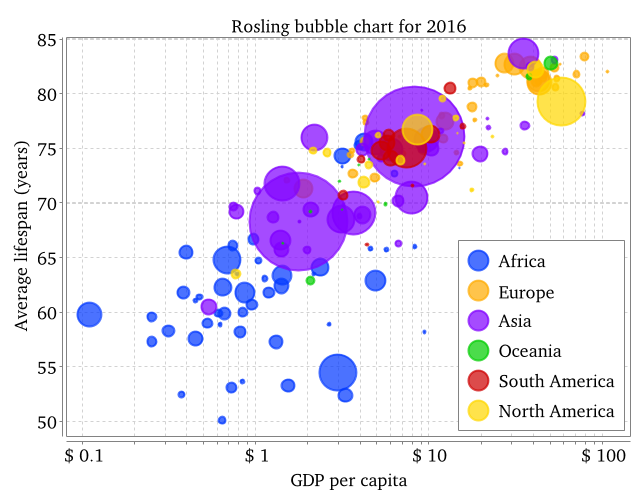
clj-xchart is a Clojure wrapper over the Java library XChart, which is a lightweight library for plotting data. Here’s an example similar to Hans Rosling’s famous bubble chart, visualised with clj-xchart:
For more examples, you can have a look over at the examples page.
clj-xchart supports all of the following chart types:
- Line charts
- Scatter charts
- Area charts
- Bar charts
- Histogram charts
- Pie charts
- Donut charts
- Bubble charts
- Stick charts
It also provides the following useful features:
- Easy to compare and make charts from a REPL
- Logarithmic axes
- Number, Date and Category X-Axis
- Export to png, gif, jpg, svg, pdf and eps
- Extensive customisation
clj-xchart does not provide these features, and most likely never will:
- Interactivity
If you want to provide such graphs to a web page, consider using a ClojureScript/JavaScript library instead. There are many good ones out there!
To use, simply add this line to your project.clj’s :dependency vector:
[com.hypirion/clj-xchart "0.2.0"]
Then read the tutorial on how to use it to generate charts.